About LightningChart JS
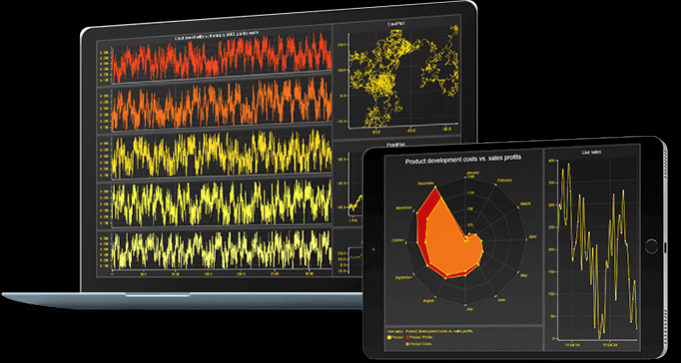
LightningChart JS comes with an outstanding execution performance - monitor dozens of data feeds simultaneously using high data rates. GPU acceleration and WebGL rendering ensure that your device's graphics processor is...
LightningChart JS's exceptionally powerful rendering ensures smooth animations exceeding all industry standards in amount of data per chart. The graphing library provides intuitive touch screen interactivity with zooming, panning, moving data cursors and so on.
Dashboard control makes it easy and convenient to manage dozens of charts, legend boxes, buttons, check boxes and other UI elements. The dashboard is rendered resource-efficiently in single GPU-scene which also makes resizing columns and rows very fast.
XY CARTESIAN CHARTS:
Series types: Line and point series, area series, area range series, OHLC series, rectangles, ellipses, box-whisker and line segment series.
Linear axes can be placed left/right/top/bottom and possibility to have several X and Y axes per chart.
Scaling modes include fitting, Expansion, Progressive/ Regressive and Manual.
Markers and data cursors have customizable shape and styles.
RADAR / SPIDER CHARTS:
Categorical automatically generated axes.
Round and lines grid.
Line, point and filled area series.
Scaling modes include fitting, expansion and manual.
Data cursors have customizable shape and styles.
PIE / DONUT CHARTS:
Slices can be styled using different fill and border-styles.
Fully customizable sorting and formatting of slices.
Slice value transitions as well as disposing/restoring are animated.
Labels can be set on side with connector-lines or inside Slices
Slices can be exploded programmatically or by mouse/touch.
FUNNEL CHARTS
Slices can be styled using different fill and stroke styles.
Slices can have empty gaps in between.
Fully customizable sorting and formatting of slices.
Labels can be set on side with connector lines or inside slices.
Two different ways to show the slices based on their values: Variable width and Variable height.
Slices can be animated. Changing values of slices, adding and removing slices support animations.
User can enable or disable animations for all slices.
Previous Versions
Here you can find the changelog of LightningChart JS since it was posted on our website on 2019-12-01 16:50:08.
The latest version is 1.0.1 and it was updated on 2024-03-29 18:57:48. See below the changes in each version.
LightningChart JS version 1.0.1
Updated At: 2019-08-21
Changes: Initial setup
Disclaimer
External Download
We do not host LightningChart JS on our servers. We did not scan it for viruses, adware, spyware or other type of malware. This app is hosted by the software publisher and passed their terms and conditions to be listed there. We recommend caution when installing it.
The external download link for LightningChart JS is provided to you by apps112.com without any warranties, representations or guarantees of any kind, so access it at your own risk.
If you have questions regarding this particular app contact the publisher directly. For questions about the functionalities of apps112.com contact us.